
Systematic Review with AI: Screen and Extract Data from Research Papers in Minutes
Learn how AI-powered structured tables replace Excel-based data extraction after screening — with source citations, dual-reviewer workflows, and analysis-ready output for systematic reviews.
TL;DR
Instill AI Collection turns systematic review data extraction into a structured, AI-assisted workflow. Upload your PDFs, define extraction rules as columns, and generate a first-pass extraction table with citations back to the source paragraph — then review, reconcile, and export analysis-ready data.
If you’ve ever done a systematic review, you know the pain: dozens of PDFs, hundreds of data points to copy into Excel, and no reliable way to trace where each number came from. According to
Borah et al. (2017)
, a typical systematic review takes over 67 weeks from registration to publication — and the data extraction phase is consistently cited as one of the most time-consuming steps in the entire pipeline.
And when two reviewers extract independently — as the
Cochrane Handbook
mandates — the problem doubles: two separate spreadsheets, no shared audit trail, and reconciliation by manual cell-by-cell comparison.
What if AI could read your papers, extract structured data into a table, and keep a citation for every single value? That’s what Instill AI Collection does.
This is the first of two articles on running a systematic review with Instill AI. Here, we walk through screening and data extraction. In
From Cited Evidence Tables to Forest Plots: Meta-Analysis with AI-Extracted Data
, we cover how to turn that structured data into forest plots, paper sections, and a living review.
Key Takeaways
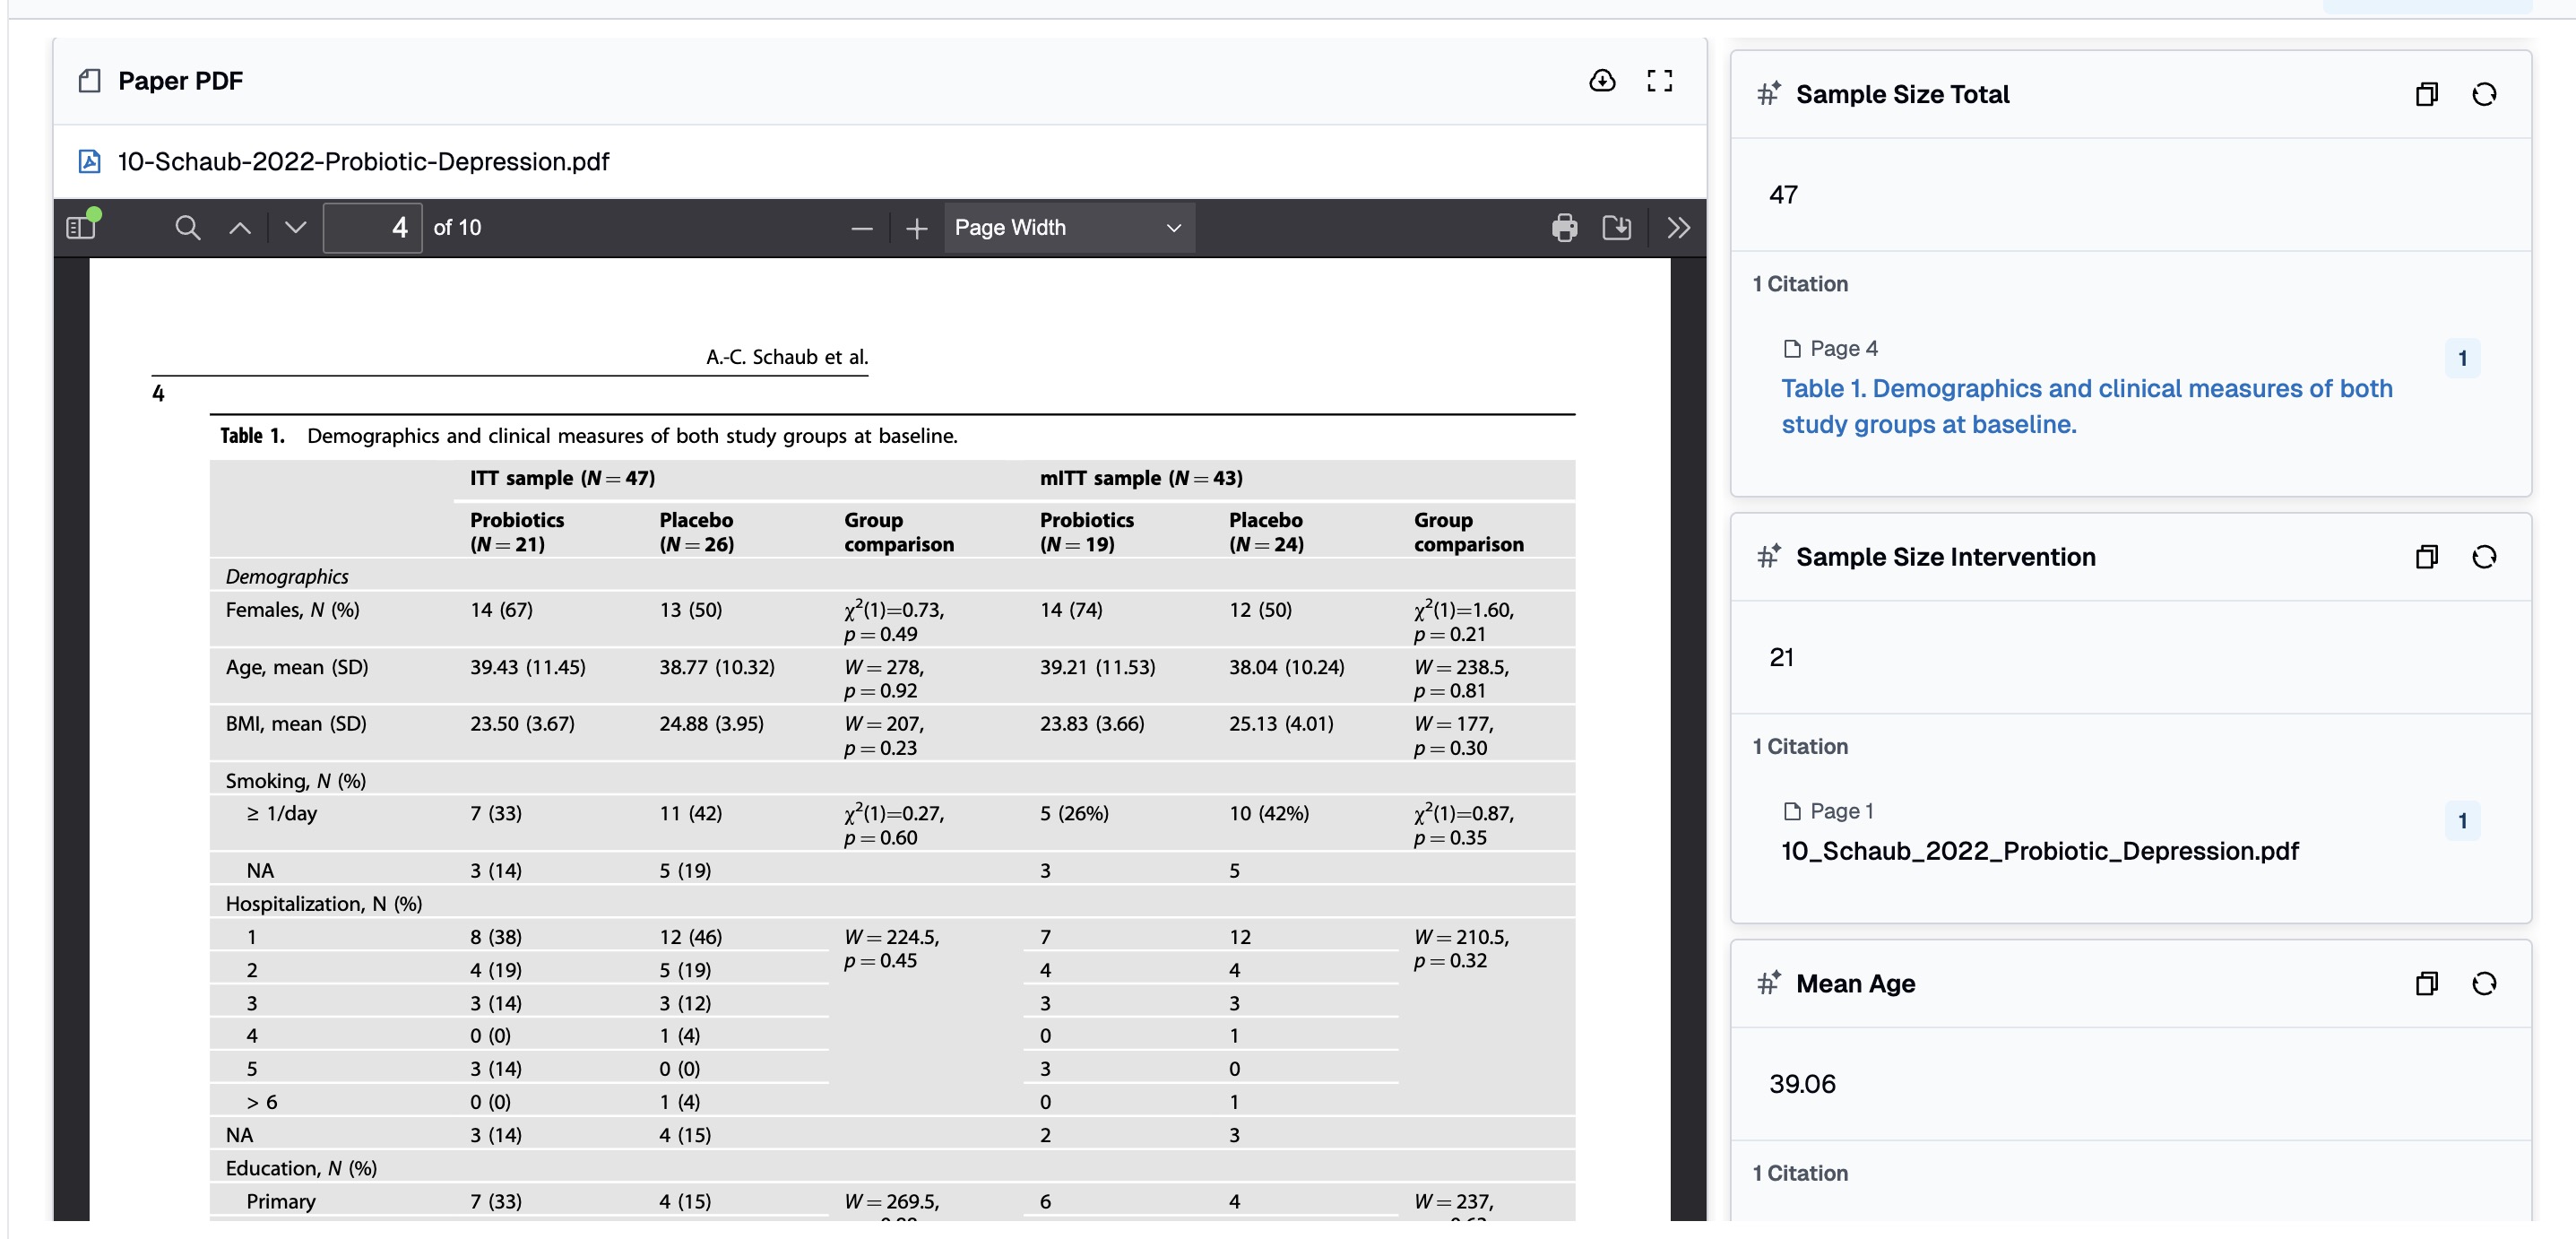
- AI reads your PDFs directly — upload papers as files, and each column extracts specific data points with citations back to the source paragraph.
- Define once, extract all — instead of asking the same question 15 times in a chat, you define each extraction rule once as a column instruction. The AI applies it to every paper.
- Dual-reviewer workflow built in — two reviewers use the same column schema
but different extraction instructions, producing the controlled disagreements
that
Cochrane methodology
requires. - Human judgment stays in the loop — not every column is AI-autofilled. Columns like “Screening Decision” and “Reviewer Confidence” are manual by design, because the final call belongs to the researcher.
- Every value is traceable — unlike Excel, every AI-extracted data point links back to the exact section of the source paper.
The Problem: Data Extraction Is the Systematic Review Bottleneck
A systematic review follows a well-defined pipeline: search → screen → extract → analyze → report. Tools like PubMed and databases handle search. Covidence handles screening. But when it comes to data extraction — the step where you actually pull numbers, outcomes, and quality assessments out of each paper — the state of the art is still a researcher with a PDF on one monitor and a spreadsheet on the other.
The
Cochrane Handbook for Systematic Reviews
(Chapter 5) mandates that at least two reviewers independently extract outcome data (Standard C46, mandatory) and recommends independent extraction of study characteristics (Standard C45, highly desirable). This requirement exists because dual extraction reduces both errors and single-person bias — but it effectively doubles the manual workload.
If you’ve been through this, the following will sound painfully familiar:
- Open PDF. Scroll to the CONSORT (Consolidated Standards of Reporting Trials) flow diagram to find how many participants were randomized. Switch to your Excel spreadsheet. Type "" into cell B7.
- Hunt for the outcome data. The mean depression score should be in the Results section — but is that the intention-to-treat (ITT) number or per-protocol completers? Check the Methods section. Cross-reference with Table 3. Finally type “17.4” into cell F7.
- Repeat for 22 more data points — exercise type, protocol details, baseline scores, post-intervention scores, standard deviations, effect sizes, risk of bias across five domains. Then repeat the entire process for 14 more papers.
- Now hand the same stack of PDFs to your co-reviewer and ask them to do it independently — because the Cochrane Handbook requires at least two reviewers extracting the same data into their own separate spreadsheets.
- Reconcile. Open both Excel files side by side. Squint at cell F7 in Reviewer A’s sheet and cell F7 in Reviewer B’s sheet. One says “17.4”, the other says “12.2”. Which is right? Where did each number come from? There’s no audit trail — just two numbers in two cells.
This is the daily reality for thousands of research teams worldwide. A
2021 study in JMIR Medical Education
found that manual systematic review processes took 2,493 minutes for comparable tasks that automation tools completed in 708 minutes — a 72% reduction. The tools haven’t meaningfully changed in decades — it’s still PDFs, spreadsheets, and manual data entry.
How Instill AI Collection Changes the Workflow
Instill AI Collection is a structured table where each column acts as a mini AI agent. Instead of copying data from PDFs into cells, the workflow starts with a single prompt:
I’m running a systematic review on exercise interventions for depression. I need to screen 15 randomized controlled trial (RCT) papers for PICO (Population, Intervention, Comparison, Outcome) eligibility.
From that one sentence, the AI generates a complete Collection — column names, data types, and extraction instructions, all pre-configured for your use case. You can use it as-is or refine any column before uploading your files. No manual schema design, no blank spreadsheet.
From there, the workflow is:
- Review and refine your columns — the AI has already set up each column with a name, a data type (text, number, single select, file), and an extraction instruction. For example, a “Post Score (Intervention)” column might say: “Extract the mean post-intervention depression score from the results section. If only change scores are reported, flag as ‘Change score only.’” Adjust any instruction to match your protocol.
- Upload your PDFs into the File column — the AI reads them directly. Once uploaded, the same set of papers can be reused across multiple collections (e.g., Screening A, Screening B, Extraction A, Extraction B) without re-uploading.
- Let autofill run — the AI processes every paper against every column instruction, producing a fully populated table with citations.
- Fill human-judgment columns manually — columns like “Screening Decision,” “Reviewer Confidence,” and “Notes” are intentionally left for the researcher. This hybrid design ensures AI handles the tedious extraction while humans retain decision authority.
The key insight: a column is not just a header — it’s an instruction. Click any column header and open its property panel — you’ll see the extraction instruction that controls exactly how the AI reads your papers for that data point.

This is where you fine-tune each column’s parsing logic. The instruction is plain natural language — no code, no formulas — and the AI applies it consistently across every paper in the collection. Want to change how the AI handles missing standard deviations? Edit the instruction in one place, re-run autofill, and every row updates. This per-column control is what makes Collection fundamentally different from a chat interface, where you’d need to rephrase and re-ask the same question once per paper.
For a systematic review with 15 papers and 23 extraction columns, that’s 345 data points — defined by 23 instructions, not 345 individual prompts.
What a Screening Collection Looks Like
In the screening phase, you need to decide which papers meet your inclusion criteria. A screening collection typically has 10 columns:
| Column | Type | AI Autofill? | Purpose |
|---|---|---|---|
| Paper PDF | File | No | The source document |
| Title | Text | Yes | Extracted from the paper |
| Authors | Text | Yes | Formatted citation style |
| Year | Number | Yes | Publication year |
| Study Design | Single Select | Yes | RCT, Quasi-experimental, etc. |
| PICO Match | Text | Yes | Does it meet Population, Intervention, Comparison, Outcome criteria? |
| Screening Decision | Single Select | No | Your judgment: Include / Exclude / Uncertain |
| Exclusion Reason | Text | No | Why a paper was excluded — filled by reviewer |
Note that “Screening Decision” and “Exclusion Reason” are manual columns — the AI provides supporting evidence (PICO assessment, study design classification), but the include/exclude call is always the researcher’s.
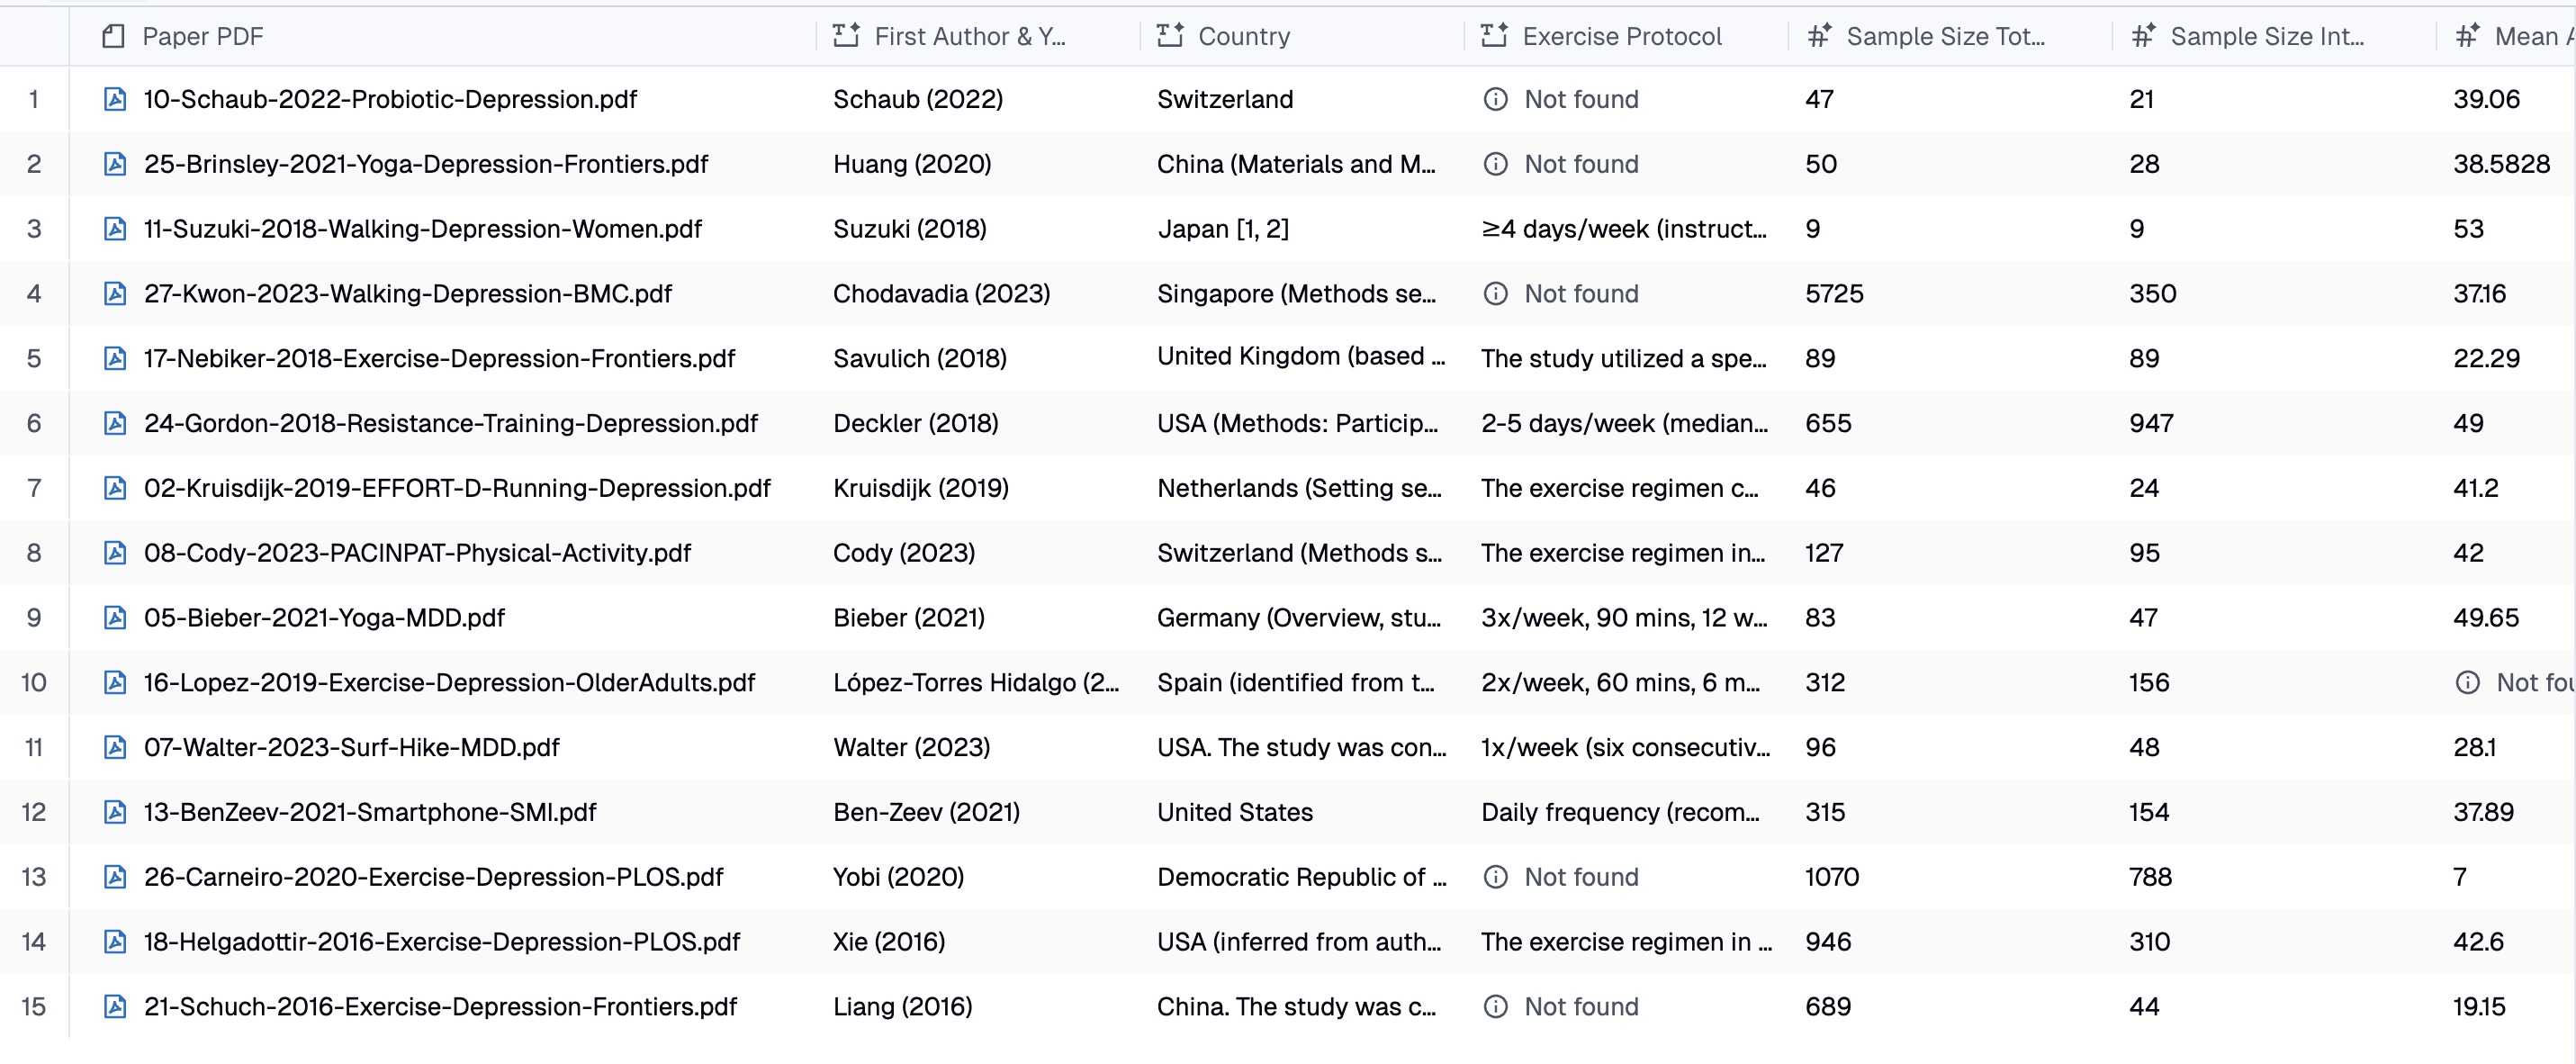
What a Data Extraction Collection Looks Like
Papers that pass screening move to a more detailed extraction collection with 23 columns covering:
- Study metadata — first author, year, country
- Intervention details — exercise type, protocol (frequency, duration, intensity), control condition
- Sample characteristics — total N, intervention N, control N, mean age, % female
- Outcome data — depression measure used, baseline scores, post-intervention scores, standard deviations, effect sizes
- Quality assessment — risk of bias across 5 domains (randomization, allocation concealment, blinding, attrition, ITT analysis)
- Human judgment — reviewer confidence (manual), free-text notes (manual)
The last two categories are intentionally manual. “Reviewer Confidence” captures how certain the researcher feels about the extraction quality for each paper. “Notes” is a free-text scratchpad for edge cases. This mix of AI-extracted and human-filled columns is what makes Collection suitable for rigorous research — it accelerates the mechanical work without removing human oversight.
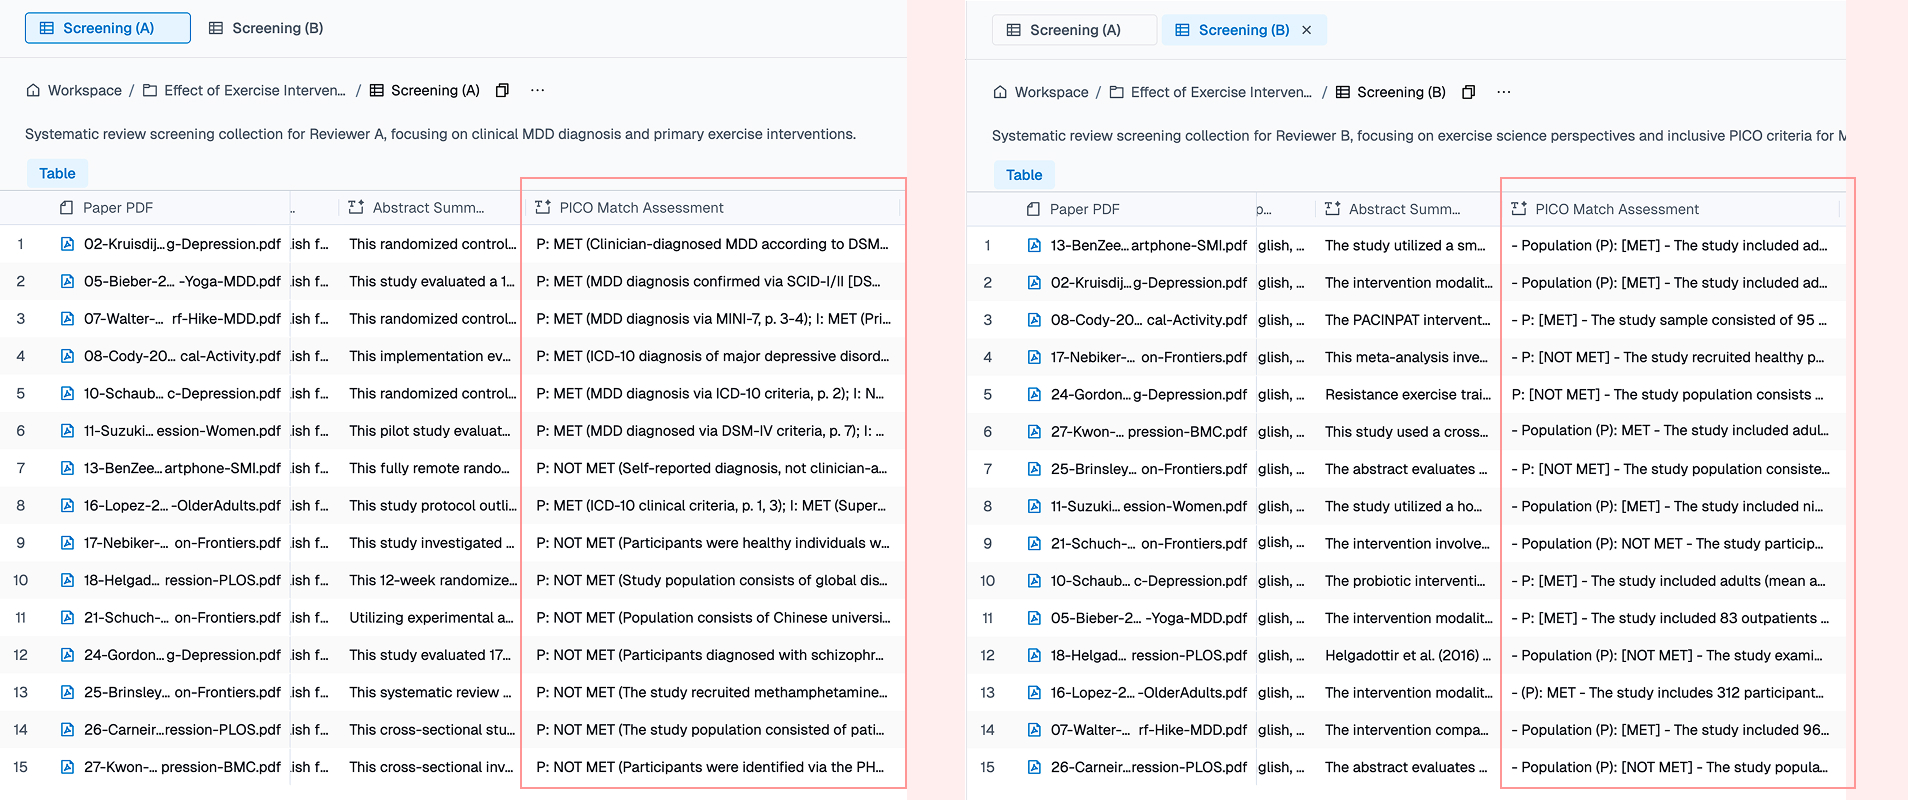
Why Two Reviewers Need Four Collections
The
Cochrane Handbook
requires at least two independent reviewers for both screening and data extraction. The purpose isn’t redundancy — it’s to surface genuine ambiguity in the source data.
Here’s the key mechanism in Collection: two collections can share the exact same column names and column types, but carry completely different column instructions. The research team agrees on a shared schema — same column names, same types, same dropdown options. Then each reviewer independently writes their own extraction instructions. Same question, different parsing rules, different outputs.
For our exercise-and-depression review, this means four collections:
| Collection | Phase | Reviewer Perspective |
|---|---|---|
| Screening — Reviewer A | Screening | Clinical psychology (strict diagnostic criteria) |
| Screening — Reviewer B | Screening | Exercise science (inclusive on depression definition) |
| Extraction — Reviewer A | Extraction | Conservative (report only what’s explicitly stated) |
| Extraction — Reviewer B | Extraction | Pragmatic (compute derived values when data supports it) |
Disagreement Is a Feature, Not a Bug
What does this look like in practice? Consider how two reviewers handle missing data differently:
| Data Point | Reviewer A (conservative) | Reviewer B (pragmatic) |
|---|---|---|
| Post-score when only change scores reported | Flags: “Change score only: -5.2” | Computes: |
| SD when only confidence interval (CI) reported | Flags: “CI reported: [12.3, 18.7]” | Converts: |
| Effect size not reported by authors | “Not reported — will compute from raw data” | Computes Cohen’s from means and SDs |
| Risk of bias when blinding not mentioned | “Unclear” | “Low risk (assumed)” if CONSORT-compliant journal |
Every disagreement forces an explicit protocol decision. The final dataset isn’t just more accurate — it’s more transparent, because every judgment call is documented.
What You Get: Structured Data You Can Actually Use
After autofill completes, you have four populated collections. The immediate value is that you can ask the AI agent questions that work across all your structured data:
Which papers report the largest effect sizes? Are those findings from high-quality studies?
This query crosses two columns — Effect Size and Risk of Bias Notes — across all rows. Because the data is already structured, the answer is instant. In a chat-only workflow, you’d need to re-read every paper to answer this.
Group the included studies by Exercise Type. How many participants are in each category?
This aggregates Exercise Type x Sample Size across all rows — a query that would require manual counting in Excel.
Compare Reviewer A and B’s extraction for Kruisdijk 2019. Where did they disagree?
This is the reconciliation step. Instead of manually diffing two Excel files, you ask the agent to compare the two collections field by field.
The fundamental advantage of a structured table over a chat interface is that knowledge persists and compounds. With structured data points, any cross-paper analysis question is just a query away — no re-reading PDFs, no re-asking the AI.
FAQ
What should a systematic review extraction tool support?
Look for PDF-native extraction, source citations tied to every value, per-column instruction control (so extraction rules are defined once and applied consistently), independent dual-reviewer workflows, and structured export to statistical tools like R or Stata. Instill AI Collection is designed around these requirements.
How do I extract data from research papers using AI?
Upload your PDFs into an Instill AI Collection, define extraction columns (e.g., “Sample Size,” “Effect Size,” “Risk of Bias”), and set a natural-language instruction for each. The AI reads each paper and fills every cell with a cited value. You review, correct if needed, and export.
How does Instill AI Collection relate to Covidence?
Covidence is strong at screening and review management. Where most teams hit a wall is the handoff to Excel for data extraction — that’s the gap Instill AI Collection closes. You keep using Covidence for screening if it works for you, then move included papers into a Collection for structured, AI-assisted extraction with source citations and dual-reviewer support.
How do I run a systematic review with AI?
The workflow is: (1) create a screening Collection and upload candidate papers, (2) let AI auto-extract metadata and PICO assessments, (3) make manual include/exclude decisions, (4) move included papers to an extraction Collection with 20+ columns, (5) let AI extract quantitative data with citations, (6) review and fill human-judgment columns, (7) export to R or Stata for statistical analysis.
Does AI replace human reviewers in a systematic review?
No. Instill AI Collection is designed as a hybrid tool — AI handles the mechanical extraction (reading PDFs, locating data points, filling cells), while humans retain decision authority through manual columns (Screening Decision, Reviewer Confidence, Notes). The Cochrane-mandated dual-reviewer process is preserved through separate collections with independent instructions.
Try It Yourself
We’ve built out the full dual-reviewer systematic review workflow — all four collections from the exercise-and-depression example used in this article, populated with 15 open-access research papers. Instill AI is currently in closed beta, so email hello@instill-ai.com for a guided walkthrough of these collections.
Compare Reviewer A and B side by side — the column schemas are identical, but open any column’s property panel and you’ll see different extraction instructions. Reviewer A uses conservative rules (“report only what’s explicitly stated”), while Reviewer B takes a pragmatic approach (“compute derived values when the data supports it”). This is how Collection enforces the independent extraction that Cochrane requires.
You can:
- Browse the schema and chat with the Collection — ask cross-paper questions like “which studies used yoga interventions?” or “compare PICO assessments for Reviewer A vs B” and see structured, cited answers.
- Clone it into your workspace — customise the extraction instructions for your own research topic, add columns for your discipline’s specific data points, and upload your own papers.
Questions?
- Try the product directly — email us with your review protocol and we’ll set up a closed-beta workspace with a collection schema designed for your topic on the spot.
- Need more help? moto.mo@instill-ai.com or click the chat icon in the bottom-right corner of this page.
The collections in this article use 15 freely available open-access research papers selected to simulate a real systematic review workflow. Some columns (Screening Decision, Reviewer Confidence, Notes) are filled by human reviewers — not all columns are AI-autofilled. This hybrid design reflects how Collection works in practice: AI handles extraction, humans handle judgment.
In the next article,
From Cited Evidence Tables to Forest Plots: Meta-Analysis with AI-Extracted Data
, we’ll show how to turn this structured extraction data into paper-ready outputs: characteristics tables, forest plots in R, and a living review powered by MCP integration.
Stop re-reading. Start knowing.
Turn scattered documents into structured knowledge — fast. Results in your first session, not your first quarter.